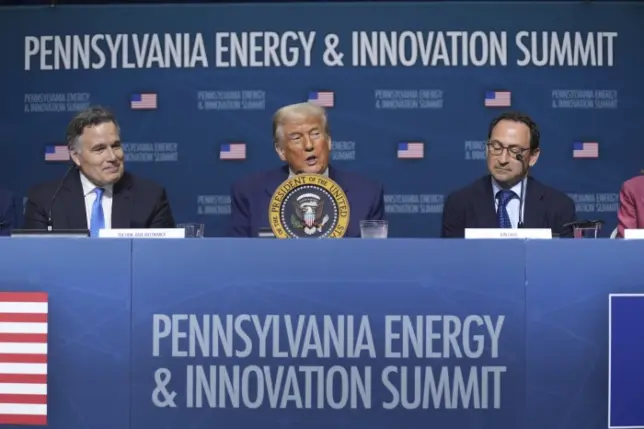
(File Photo: Source for Photo: President Donald Trump speaks at the “Inaugural Pennsylvania Energy and Innovation Event” at Carnegie Mellon University, Tuesday, July 15, 2025, in Pittsburgh, as Sen Dave McCormick, R-Pa., left, and Jon Gray, President and Chief Operating Officer, Blackstone, right, look on. (AP Photo/Evan Vucci)
PITTSBURGH (AP) — President Donald Trump touted tens of billions of dollars of recent energy and technology investments Tuesday in Pennsylvania while boasting of a “true golden age for America” in energy policy and artificial intelligence.
Trump traveled to Pittsburgh at a summit helmed by Republican Sen. David McCormick that included dozens of top executives from companies aiming to make the city and the state a hot spot for advancements in robotics, artificial intelligence and energy. McCormick announced more than $90 billion of investments in the state — spurring tens of thousands of jobs — although some of the projects had already been in progress ahead of the summit.
“I think we have a true golden age for America. And we’ve been showing it, and it truly is the hottest country anywhere in the world,” Trump said at the Pennsylvania Energy and Innovation Summit, held at Carnegie Mellon University. “I’m honored to be in Pennsylvania, and I’m honored to be in Pittsburgh. And you’re going to see some real action here. So get ready.”
Trump has repeatedly pledged U.S. “energy dominance” in the global market, and Pennsylvania — a swing state critical to his wins in 2016 and 2024 — is at the forefront of that agenda, in large part due to its coal and gas industry that the Republican administration has taken steps to bolster.
Both the president and senior administration officials on Tuesday framed the investments as part of a race against China for the most advanced deployment of artificial intelligence, with Trump saying, “We are way ahead of China, I have to say.”
“China and other countries are racing to catch up to America on AI, and we’re not going to let them do it,” Trump said during the hourlong roundtable held in a university gymnasium, speaking often from prepared notes. Flanked by several of his Cabinet members, company executives and local political leaders, Trump added that the U.S. will be “fighting them in a very friendly fashion.”
Before Trump spoke, his Cabinet members spoke of the need to produce as much energy as possible — especially from coal and natural gas — to beat China in the AI race for the sake of economic and national security.
“The AI revolution is upon us,” Commerce Secretary Howard Lutnick said during an earlier panel discussion. “The Trump administration will not let us lose. We need to do clean, beautiful coal. We need to do natural gas, we need to embrace nuclear, we need to embrace it all because we have the power to do it and if we don’t do it we’re fools.”
Some of the investments on a list released by McCormick’s office were not necessarily brand-new, while others were. Some involve massive data center projects — such as a $15 billion project in central Pennsylvania — while others involve building power plants, expanding natural gas pipelines, upgrading power plants or improving electricity transmission networks.
Google said it would invest $25 billion on AI and data center infrastructure over the next two years in PJM’s mid-Atlantic electricity grid, while investment firm Brookfield said it had signed contracts to provide more than $3 billion of power to Google’s data centers from two hydroelectric dams on the Susquehanna River in Pennsylvania.
Frontier Group said it would transform the former Bruce Mansfield coal-fired power plant in western Pennsylvania into a new natural gas-fired plant, and AI cloud computing firm CoreWeave said it will spend more than $6 billion to equip a data center in south-central Pennsylvania.
Blackstone plans to spend $25 billion on data centers and building new natural gas-fired power plants in northeastern Pennsylvania, and the company will start construction by the end of 2028, said Jon Gray, its CEO.
McCormick, a first-term Republican senator who organized the inaugural event, said the summit was meant to bring together top energy companies and AI leaders, global investors and labor behind Trump’s energy policies and priorities.
The list of participating CEOs includes leaders from global behemoths like Blackstone, Bridgewater, SoftBank, Amazon Web Services, BlackRock and ExxonMobil and local companies such as the Pittsburgh-based Gecko Robotics, which deploys AI to bolster energy capacity.
“What’s exciting about this event is it’s a great catalyst for investments and closing deals in the region,” said Jake Loosararian, the founder and CEO of Gecko Robotics.
Administration officials at the summit included White House crypto czar David Sacks, Energy Secretary Chris Wright and Lutnick. Treasury Secretary Scott Bessent and Interior Secretary Doug Burgum also attended. Gov. Josh Shapiro, a Democrat, also spoke.
McCormick credited his wife, Dina Powell McCormick, with the idea for a summit. Powell McCormick served as Trump’s deputy national security adviser in his first term and is a former Goldman Sachs executive who is now at BDT & MSD Partners, a merchant bank.
Pittsburgh is home to Carnegie Mellon University, a prestigious engineering school, plus a growing industry of small robotics firms and a so-called AI Avenue that’s home to offices for Google and other AI firms. It also sits in the middle of the prolific Marcellus Shale natural gas reservoir.
“What’s going on is a rewiring of the economy, of the world over the next 15 years and that takes trillions and trillions and tens of trillions of dollars, and it starts with power,” said Bruce Flatt, CEO of Brookfield, during a panel discussion.
Pennsylvania has scored big investment wins in recent months, some driven by federal manufacturing policy and others by the ravenous need for electricity from the fast-growing AI business.
Nippon Steel just bought U.S. Steel for almost $15 billion, getting Trump’s approval after pledging to invest billions alone in U.S. Steel’s Pittsburgh-area plants.
Amazon will spend $20 billion on two data center complexes in Pennsylvania, while the one-time Homer City coal-fired power plant is being turned into the nation’s largest gas-fired power plant to fuel a data center campus. Meanwhile, Constellation Energy is reopening the lone functional nuclear reactor on Three Mile Island under a long-term power supply agreement for Microsoft’s data centers.